.JPG)
.JPG)
.JPG)
.JPG)
.JPG)
.JPG)
.JPG)
.JPG)
.JPG)
.JPG)
Introduction
Freight is generally described as the movement of goods or cargo between two points. There is no standard limit in size, quantity or type of the cargo being transported that qualifies it to be called freight.
Limpopo's geographical position
Limpopo is situated as a regional hub, with direct access to 3 neighbouring countries, and to South Africa's economic hub, the Gauteng province. The 3 neighbouring countries are Botswana, Zimbabwe, and Mozambique. This geographical position has seen the province experience a high volume of freight movement, especially on the N1 corridor, linking Zimbabwe and Gauteng. Two national roads pass through the province, namely; the N1 and N11 routes. The N11 route links the Mpumalanga province, Limpopo province, and Botswana.
National Freight
Currently, road transport is the most used mode of transport in Limpopo. This is in line with the country's trend. According to the State of Logistics Survey for South Africa, 2010, road freight constitutes 88.7% of all freight movement in the country, whilst the rail freight constitutes 11.3%. The choice of road as a means of freight transport is influenced in some instances by: reliability of mode, time to reach destination, safety of goods, and ease of access to collection or delivery points.
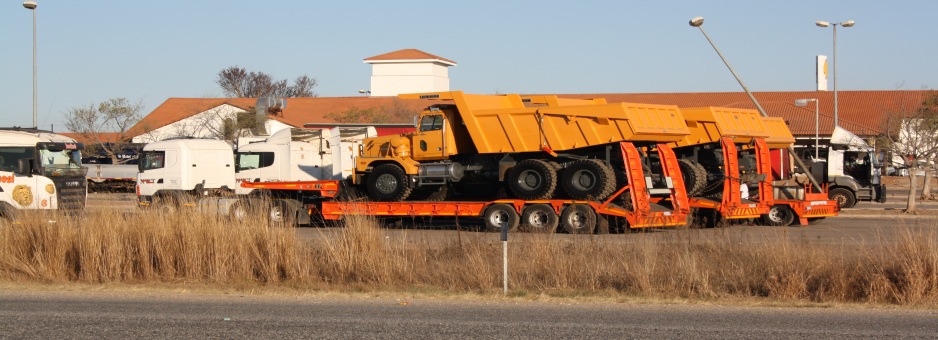
Approach
In the road freight study, only goods moved by means of trucks and buses were observed. The main reasons for this are that:
- the freight movement and type are easily recognisable,
- they move high volumes in a single trip,
- and have the greatest impact on traffic flow and road conditions
Road freight traffic surveys were conducted so as to ascertain the following information per route:
- Volume of freight traffic flow
- Commodity type
- Vehicle type
- Trailer type
- Weight estimate
- Origin and destination
The routes that were surveyed, including the survey point coordinates are given in the table below
Table: Road freight traffic survey points
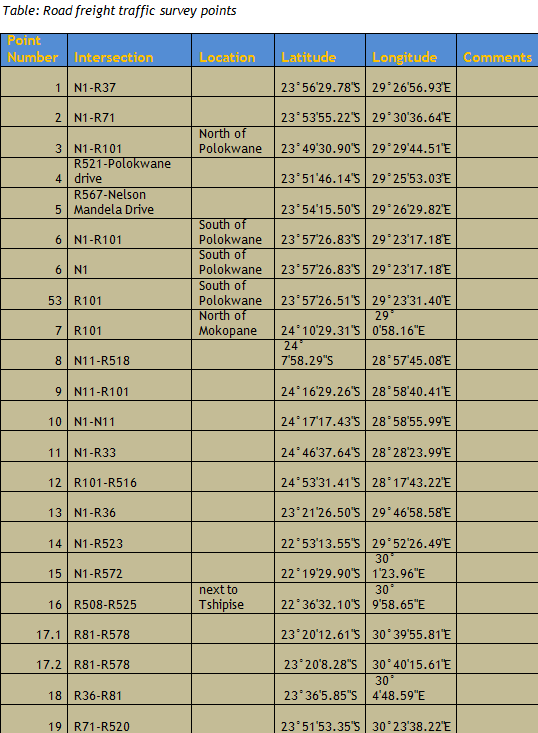
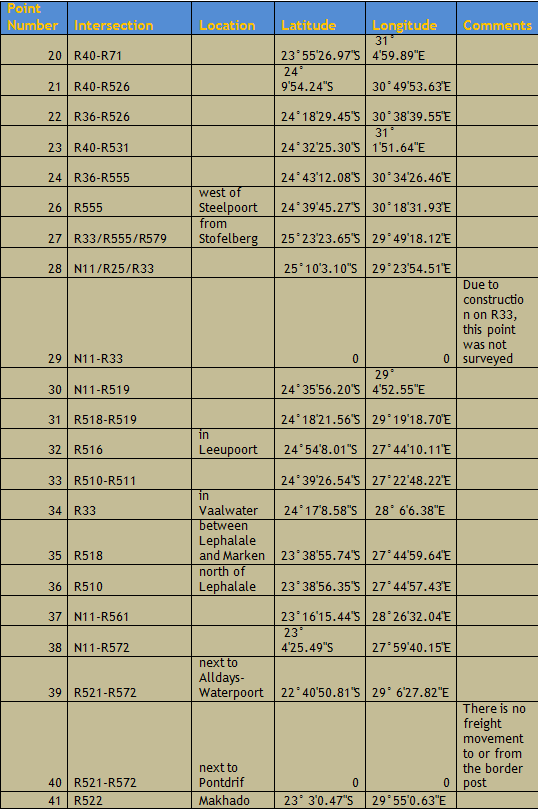
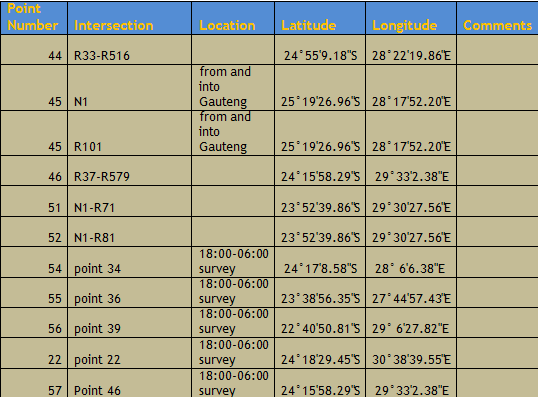
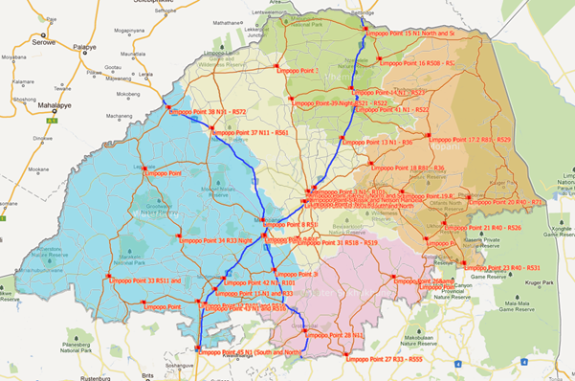
Figure: Location of road survey points
Observations of Freight Traffic Flow
The volumes were collected within a twelve hour period (6 am - 6 pm) per survey point. The information thus gives us a snap shot view of the route activity, as opposed to the actual activities. Four points (34, 36, 39, and 49) were identified for 24 hour surveys. SANRAL data was also used for verification purposes. Together with assumptions made, the snapshot information is used to infer on the annual route activity.
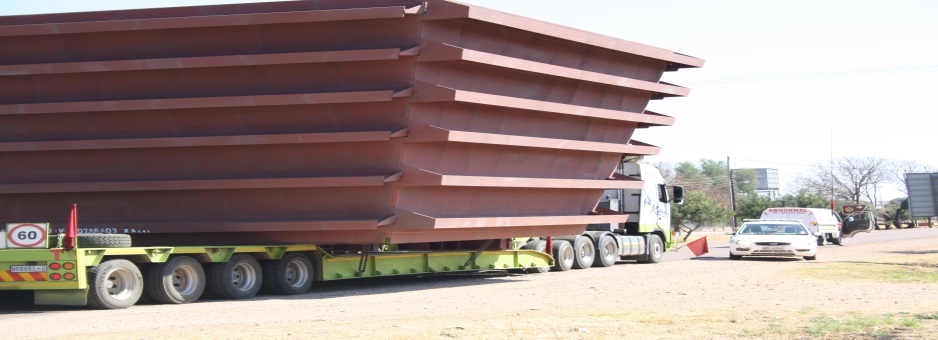
Commodity Type
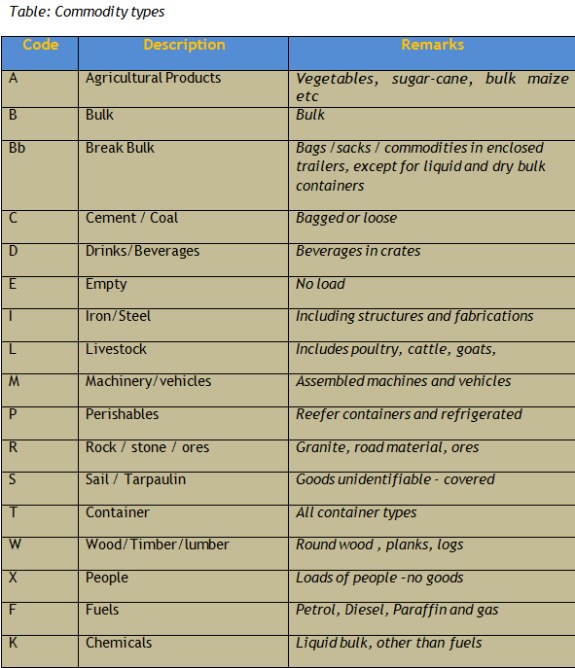
Commodities are classified and named as shown in table below. The commodities were physically identified as the cargo moved through the survey point.
Table: Commodity types
Vehicle Categories
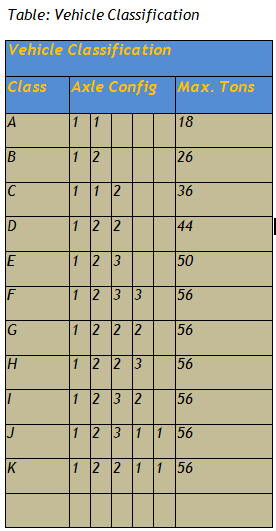
For ease of tonnage estimate, it was decided that the vehicles be classified according to the traffic control centre categories that are used to monitor overloading. For vehicle classification, the axle configuration is used as shown in the table below. Unfortunately, not all vehicles observed in the study fit into these categorizations.
Table: Vehicle Clasification
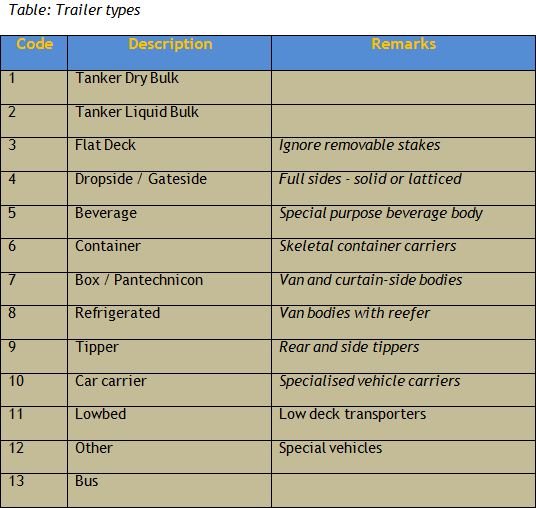
Trailer type
Trailer types are classified and named as shown in the table below. The vehicle types were physically identified as the cargo moved through the survey point.
Table: Trailer types
Weight estimate
The heavy vehicles on South African roads are designed for specific functions and therefore have a wide range of different forms and configurations. The capacity of different configurations is defined by the number and location of the axles and the tare weight of the vehicle or combination.
During the study, only visual surveys were conducted, and no weighing of the trucks was done. This required that a weight estimate of the observed trucks be done, using the observed axle configuration per truck. The figure shows the maximum weight per axle configuration permissible in SA. For the calculation of the estimated weight per truck, an average maximum load of 8.5 tons per axle was used.
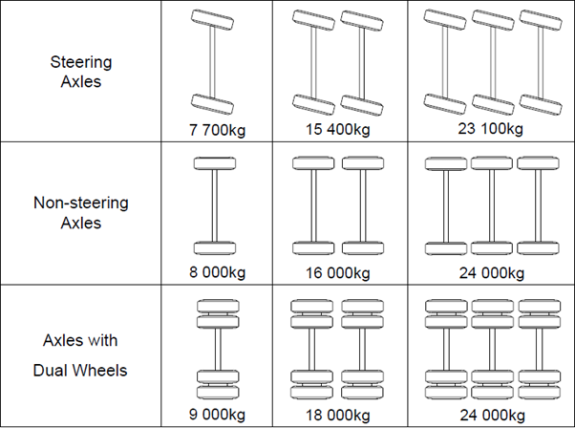
Figure: maximum permissible weight per axle configuration
The observed number of trucks per survey point over a 12 hour period (6am - 6pm) is shown in the table, and figure below. The routes with the highest volumes, above 1000, are, N1, and Rissik and Nelson Mandela intersection.
Table: Traffic volume per survey point
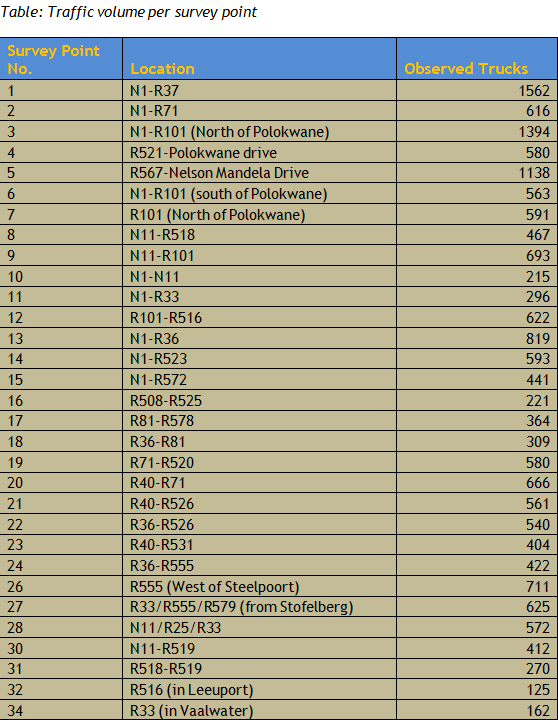
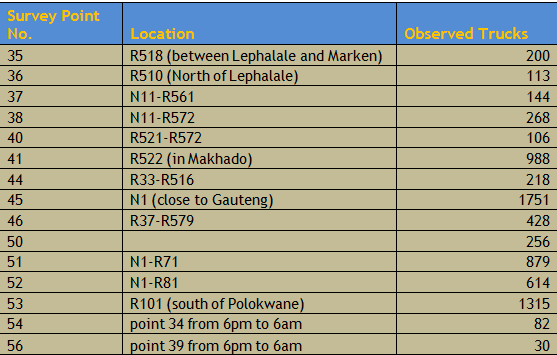
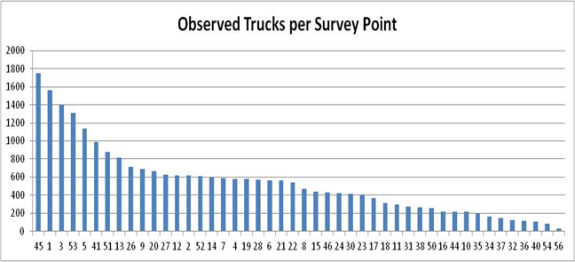
Figure: Total number of trucks observed per survey point
ii.Estimated tonnages per survey pointThe tonnages shown exclude the empty trucks observed. When comparing the number trucks observed and the tonnages estimated, it can be observed that the rankings do not exactly match. For instance, point 53 has less observed trucks than points 1 and 3, but when comparing the estimated observed tonnages, point 53 has more tonnages than point 1 and 3. The reasons for this include the vehicle configurations that are prevalent on a route, and the number of empty trucks observed per route.
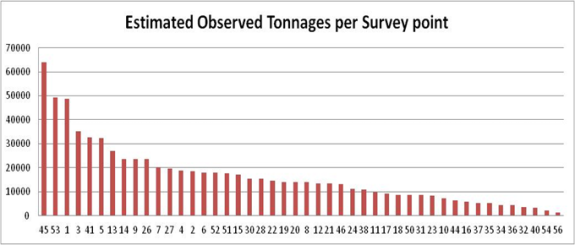
Figure: Estimated total tonnages per survey point
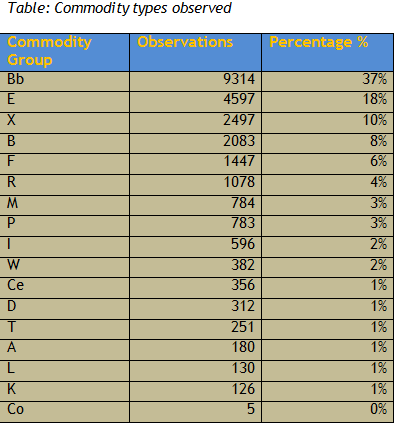
iii.Observed commodities per survey pointDue to the fact that most of the goods being transported are either covered or enclosed, it was not possible to identify all of the commodities, but instead commodity groupings were used. Commodities that are either covered or enclosed are classified as either bulk or break bulk depending on the trailer type. Thus it would have been expected that the majority of the commodity groups would have been bulk (B) and break bulk (Bb). The table below shows the observed commodity groups.
Table: Commodity types observed
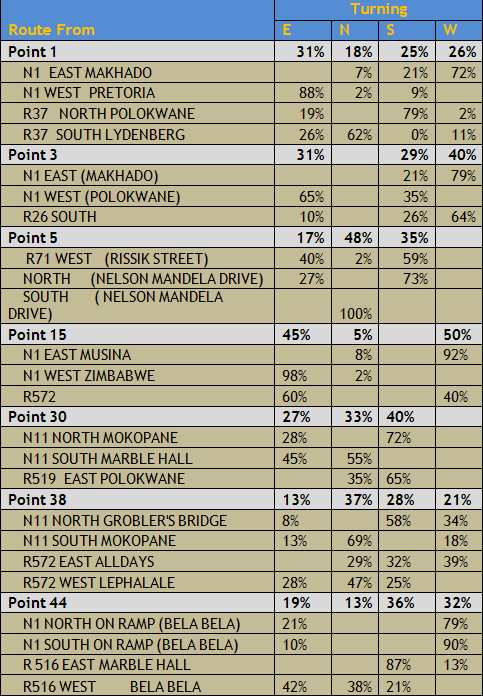
Intersection traffic flow
Part of the surveys was to observe the traffic flow at selected intersections. This gave an indication as to which direction the traffic flowed when it reached the intersection.
The data that has been discussed above is observed data; that is, the actual data has not been manipulated. For traffic information, it is common to use annual figures and indicators. The most commonly used annual indicator is the 'Average Daily Traffic' (ADT). This indicator gives one a sense of how much traffic moves on a certain route per any given day in a year.
As indicated earlier, our study covered only 12 hours (6am to 6pm) per point. There were 4 points that were monitored over a 24 hour period, and these gave an indication of the truck traffic flow at night. To convert the available data into an Average Daily Truck Traffic (ADTT), the following process was followed:
- Night surveys were conducted at four different sites so as to get an indication of the night truck traffic flow
- SANRAL data was also used to get the percentage of night traffic. Only SANRAL points close to the survey points were used as indicators for the night traffic flow. This information was used to extrapolate the observed data into a 24 hour data.
- SANRAL data was also used to get the weekly traffic flow pattern so as to calculate the weekly traffic flow
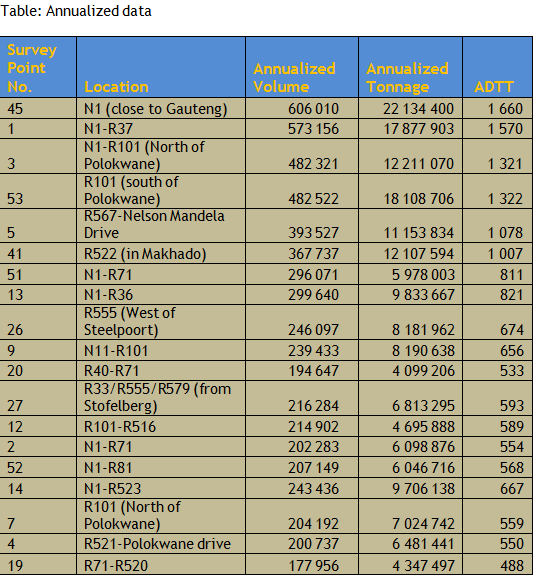
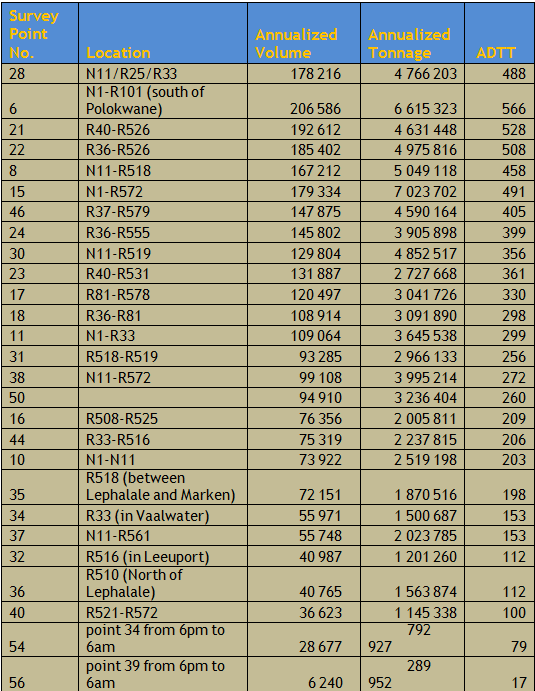
The table below shows the results of the annualization of the observed data. It should be noted that this is only an estimation based on a 12 hour survey. For a more accurate output, it is recommended that the surveys be conducted over a longer period, and seasonality should also be taken into consideration. For accurate ADTT, it recommended that the SANRAL data be used.
Table: Annualized data
In Limpopo, four origin and destination surveys were conducted. These were conducted at four traffic control centres (TCC), namely;
- Beit Bridge TCC on the N1 next to the Beit Bridge Border Post
- Grobler's Bridge TCC on the N11 next to the Groblers Bridge Border Post
- Mantsole TCC on the N1 next to the Gauteng Province, and
- Rathoke TCC on the N11 between Marble Hall and Roedtan
Beit Bridge TCC
Table: Beit Bridge O&D survey results
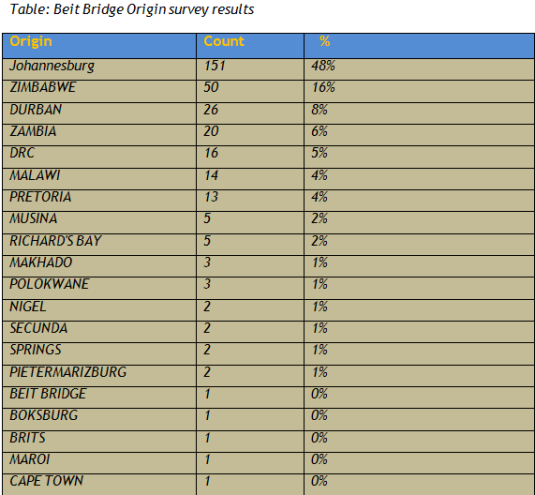
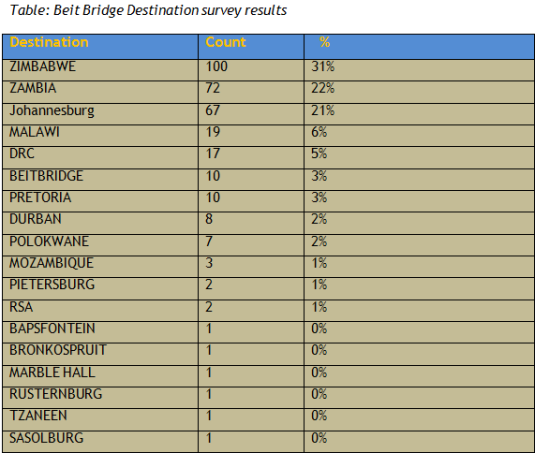
From the analysis of the observed freight movement at the Beit Bridge TCC, about 55% of the freight is from the Gauteng province, whilst 65% is destined across the borders of South Africa. 31% of the freight originates from the neighbouring countries, with Zimbabwe accounting for 16 %.
Grobler's Bridge TCC
Table9: Grobler's Bridge O&D survey results
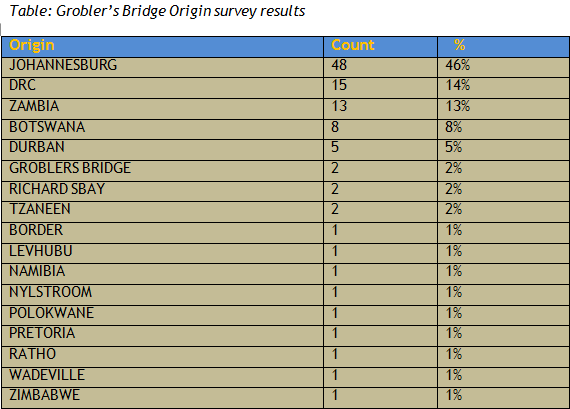
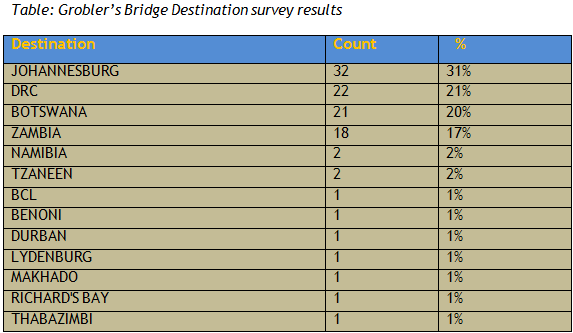
From the analysis it can be seen that 48% of the freight originates from Gauteng, 37% from neighbouring countries, and only about 6% from within Limpopo. 58% of the freight is destined for neighbouring countries, 32% for Gauteng province, and about 4% is destined within the Limpopo province.
Mantsole TCC
Table: Mantsole TCC O&D survey results
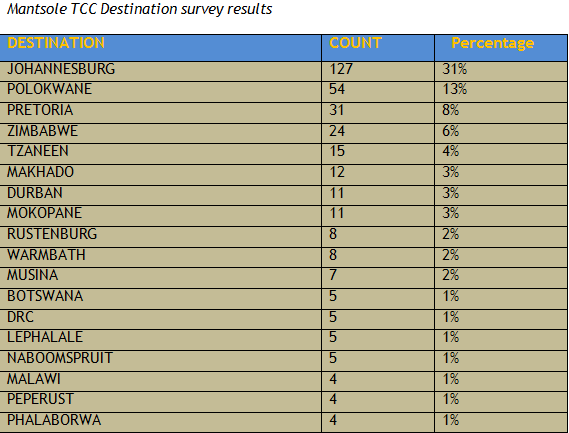
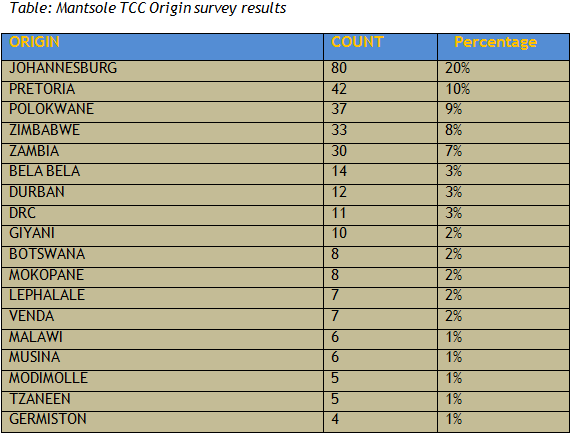
From the above table, it can be seen that 31% of the freight movement originates from the Gauteng province, and 23% originates within the Limpopo province. 39% of the freight is destined for the Gauteng province, and 31% is destined for places within the Limpopo province. For cross border freight, 21 % originates from neighbouring countries, and 8% is destined for neighbouring countries.
Rathoke TCC
Table: Rathoke TCC O&D survey results
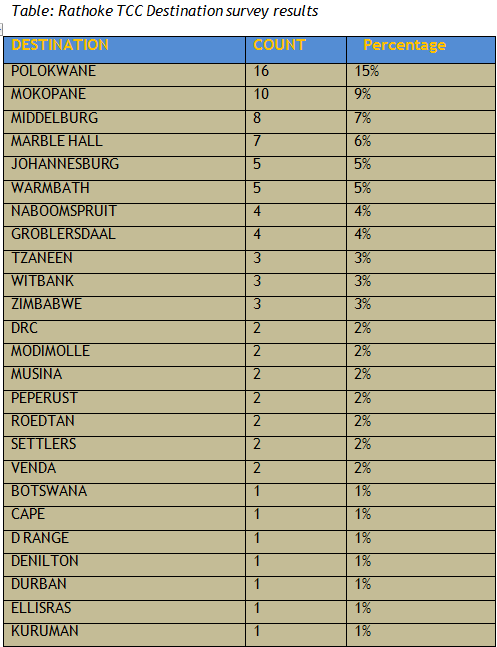
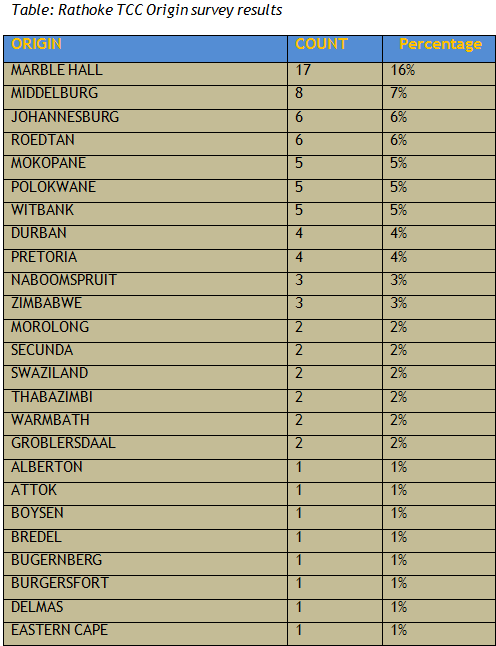
At the Rathoke TCC it was observed that 44% of the freight originates from within the Limpopo province, 15% from the Mpumalanga province, and 11% from the Gauteng province. It was also observed that about 60% of the freight is destined for places within the province, and only 6% is destined for neighbouring countries.
Main Menu

Other Links
Copyright © 2012 Limpopo Province Freight Transport Data Bank | Developed and Powered by Safiri South Africa.